This section describes how to provision and connect to ‘TiDB with Grafana & Prometheus: Real-Time Data & Analytics’ VM solution on GCP.
Open TiDB with Grafana & Prometheus: Real-Time Data & Analytics listing on GCP Marketplace
Click Get Started.
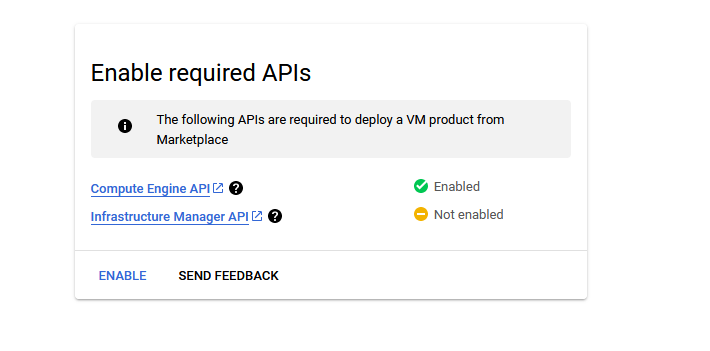
It will ask you to enable the API’s if they are not enabled already for your account. Please click on enable as shown in the screenshot.
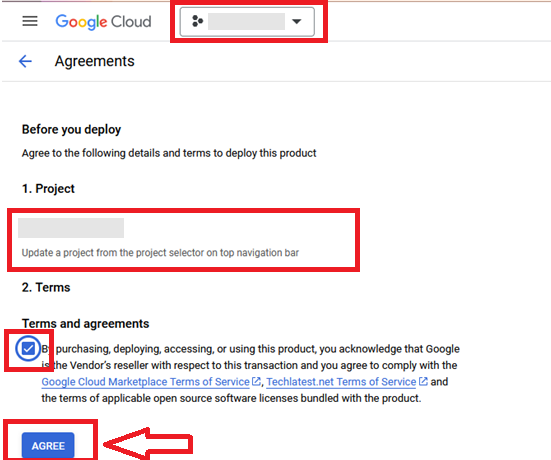
It will take you to the agreement page. On this page, you can change the project from the project selector on top navigator bar as shown in the below screenshot.
Accept the Terms and agreements by ticking the checkbox and clicking on the AGREE button.
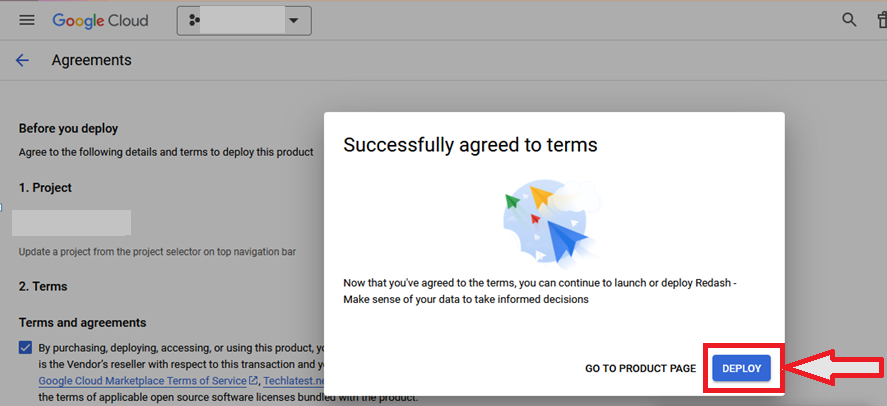
It will show you the successfully agreed popup page. Click on Deploy.
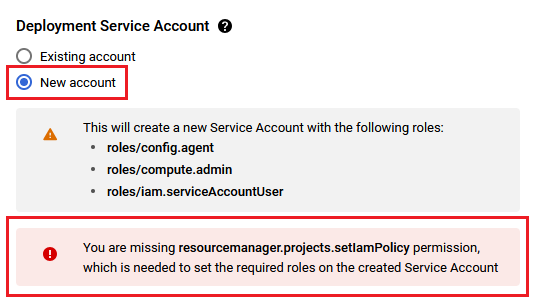
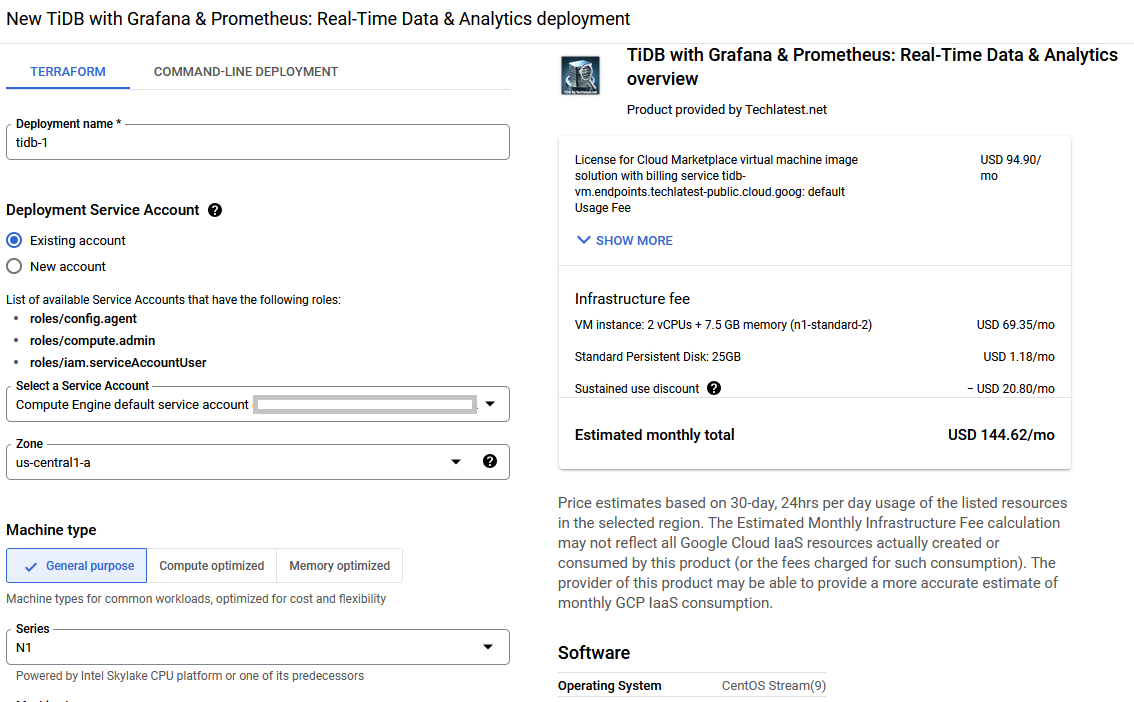
On deployment page, give a name to your deployment.
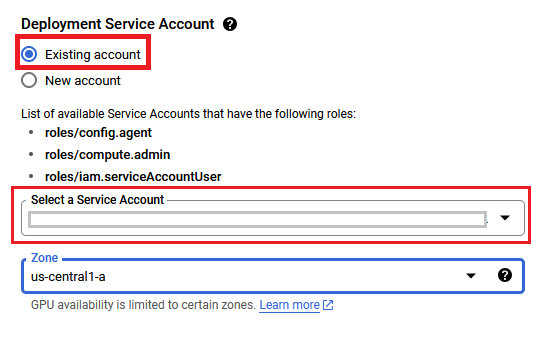
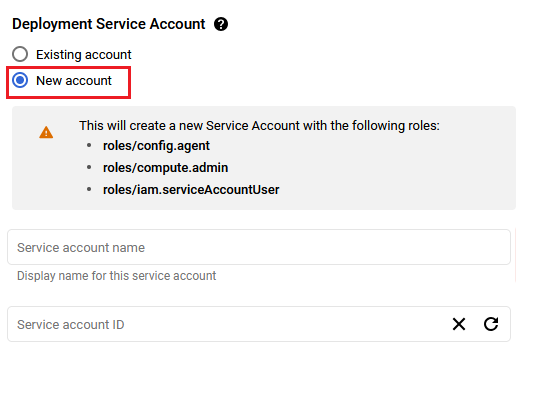
You are missing resourcemanager.projects.setIamPolicy permission, which is needed to set the required roles on the created Service Account
Select a zone where you want to launch the VM(such as us-east1-a)
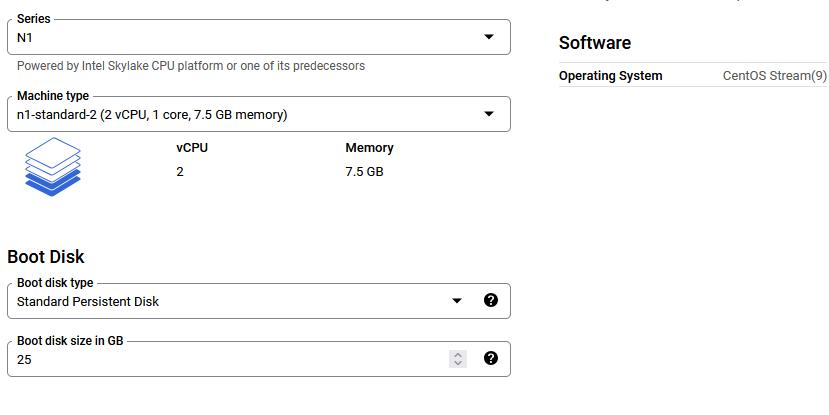
Optionally change the number of cores and amount of memory. ( This defaults to 2 vCPUs and 8 GB RAM)
Optionally change the boot disk type and size. (This defaults to ‘Standard Persistent Disk’ and 25 GB respectively)
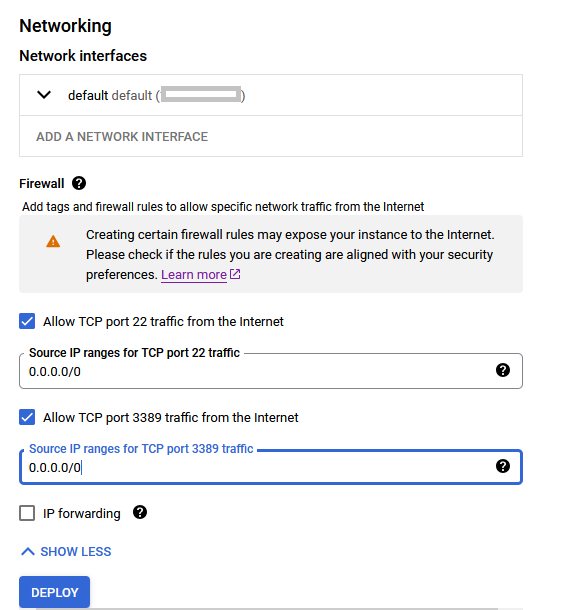
Optionally change the network name and subnetwork names. Be sure that whichever network you specify has ports 22 (for ssh) and 3389 (for RDP) exposed.
Click Deploy when you are done.
TiDB with Grafana & Prometheus: Real-Time Data & Analytics will begin deploying.
A summary page displays when the compute engine is successfully deployed. Click on the Instance link to go to the instance page .
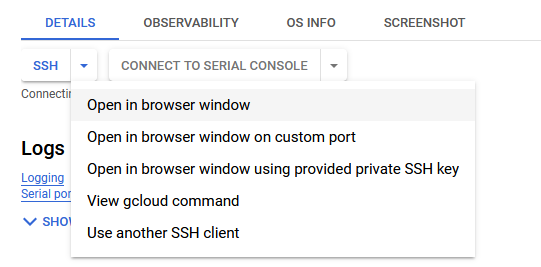
On the instance page, click on the “SSH” button, select “Open in browser window”.
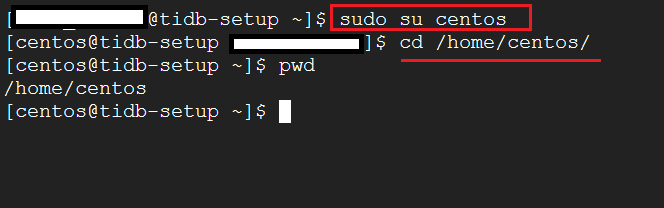
sudo su centos
cd /home/centos/
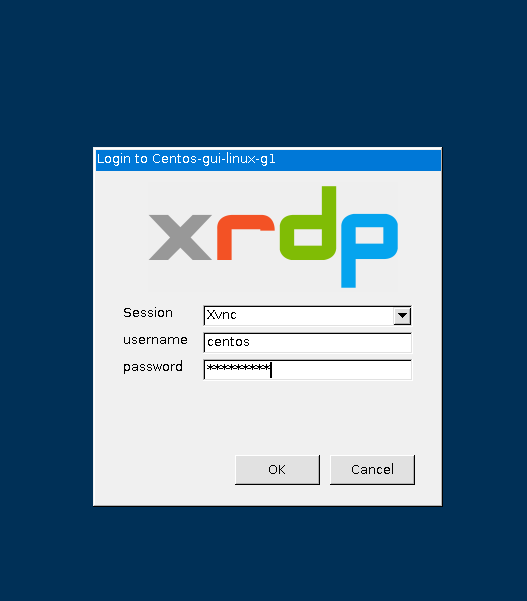
sudo passwd centos
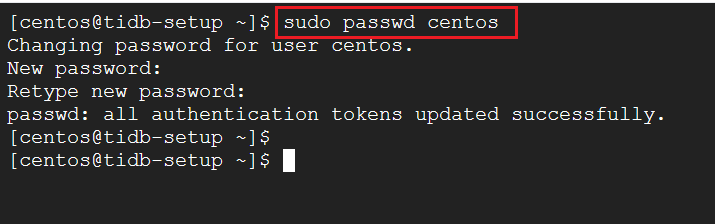
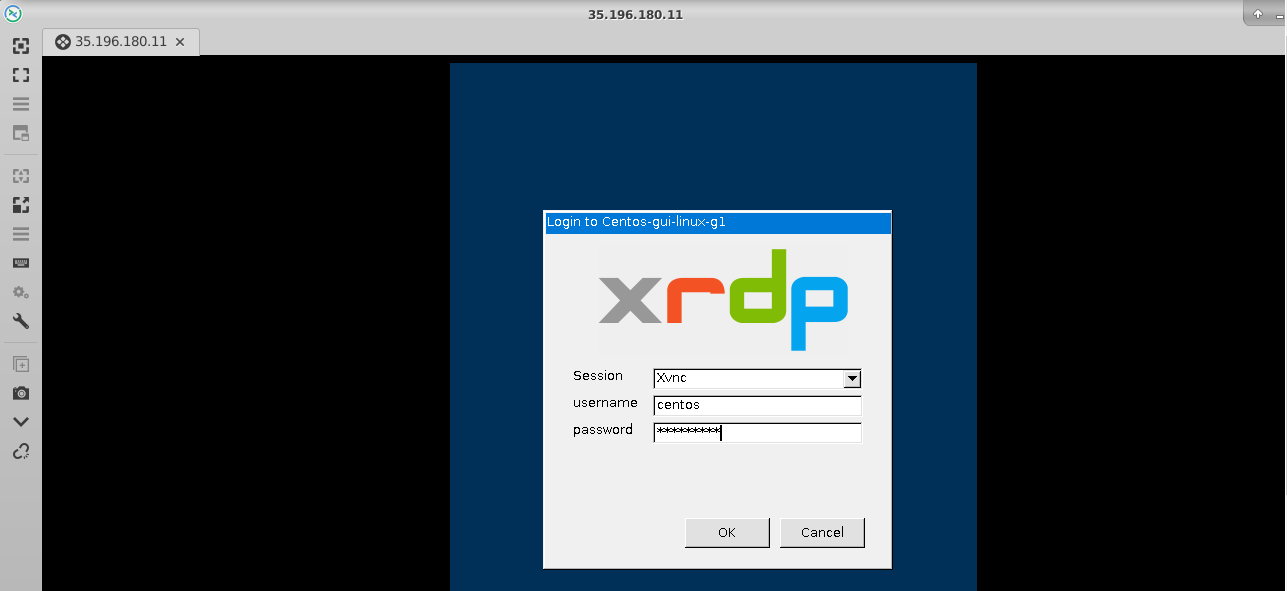
Now the password for centos user is set, you can connect to the VM’s desktop environment from any local windows machine using RDP or linux machine using Remmina.
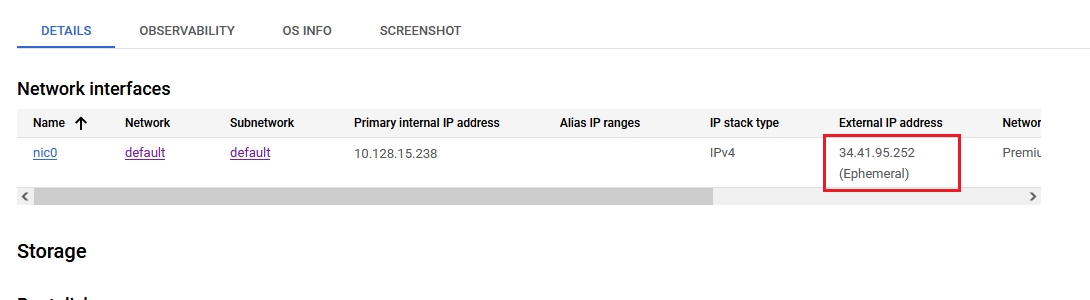
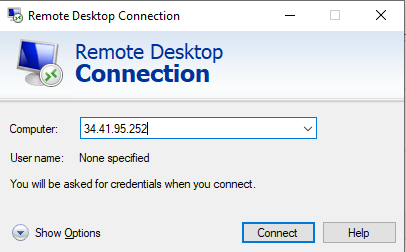
To connect using RDP via Windows machine, first note the external IP of the VM from VM details page as highlighted below
Then From your local windows machine, goto “start” menu, in the search box type and select “Remote desktop connection”
In the “Remote Desktop connection” wizard, paste the external ip and click connect
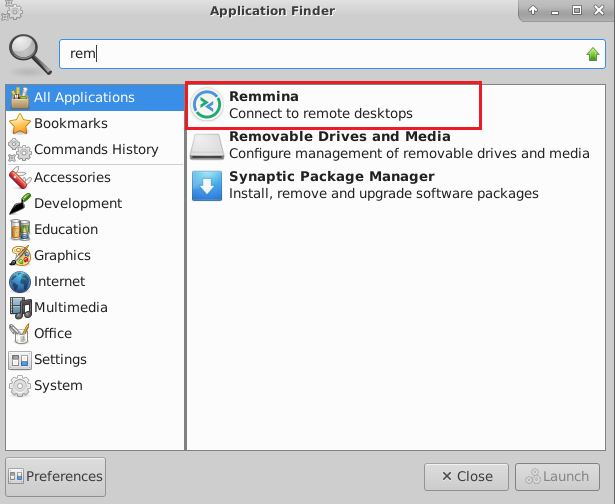
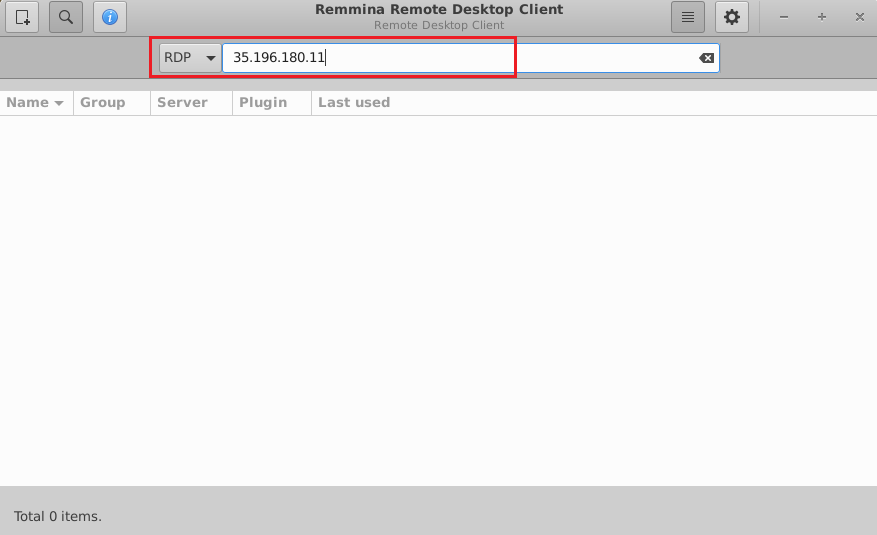
To connect using RDP via Linux machine, first note the external IP of the VM from VM details page,then from your local Linux machine, goto menu, in the search box type and select “Remmina”.
Note: If you don’t have Remmina installed on your Linux machine, first Install Remmina as per your linux distribution.
NOTE: The User Inerfaces for TiDB, Grafana and Prometheus are accessible only via Remote Desktop and not on public internet due to security purpose and not to expose the DB on public internet.
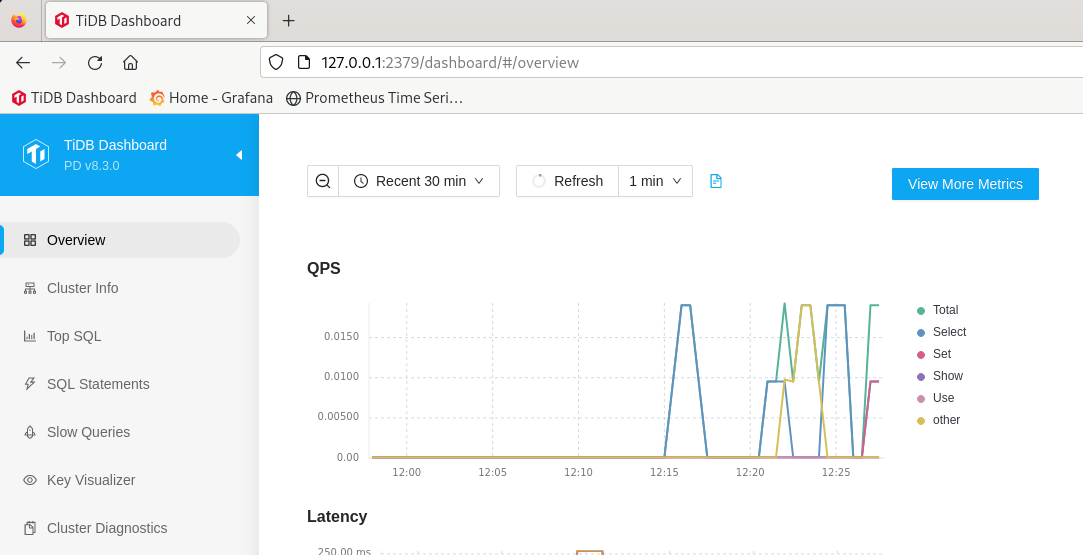
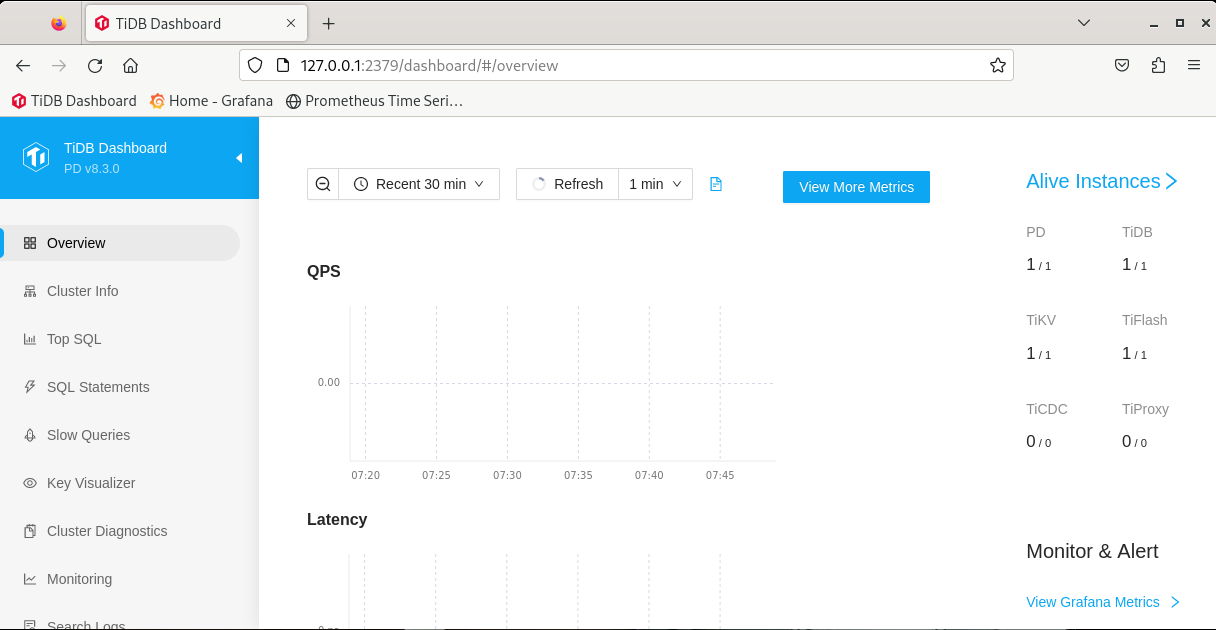
TiDB dashboard-> http://127.0.0.1:2379/dashboard
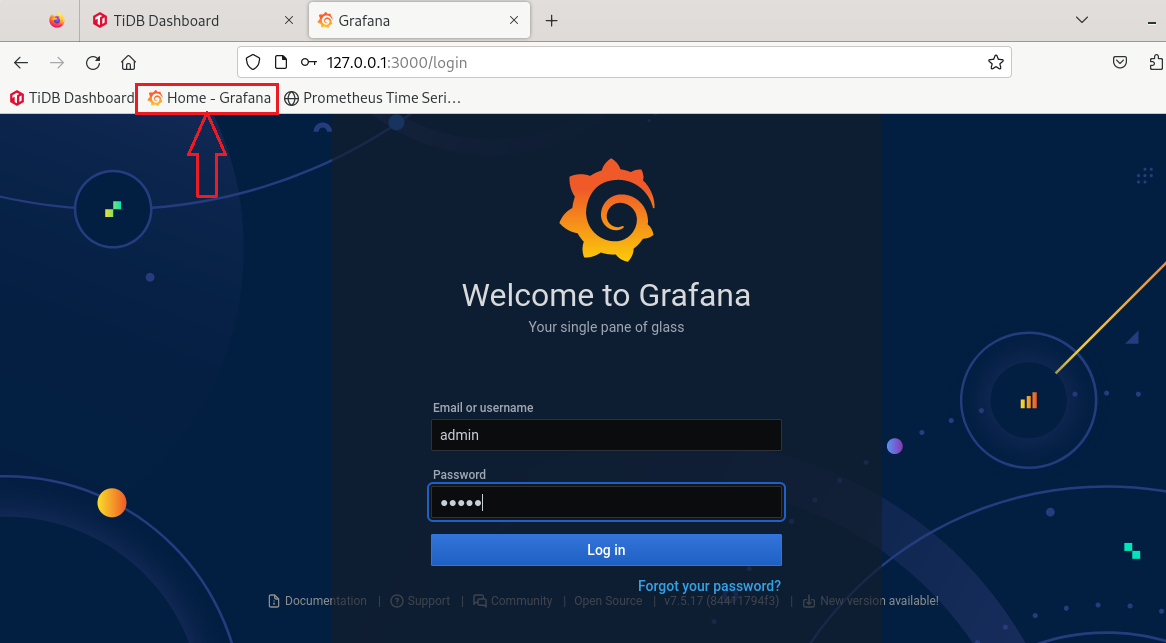
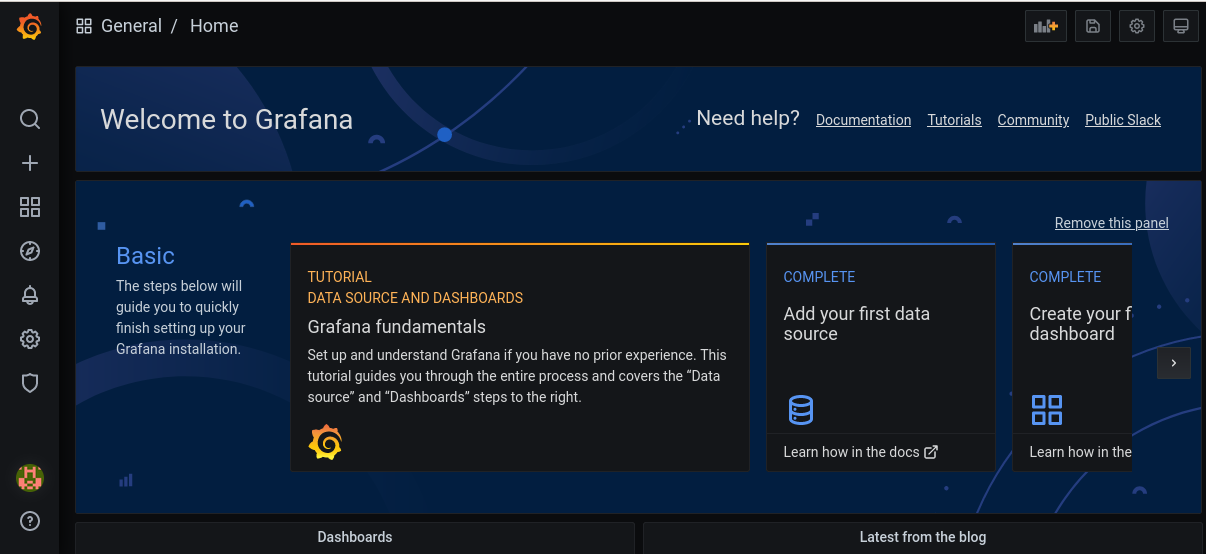
Grafana UI-> http://127.0.0.1:3000
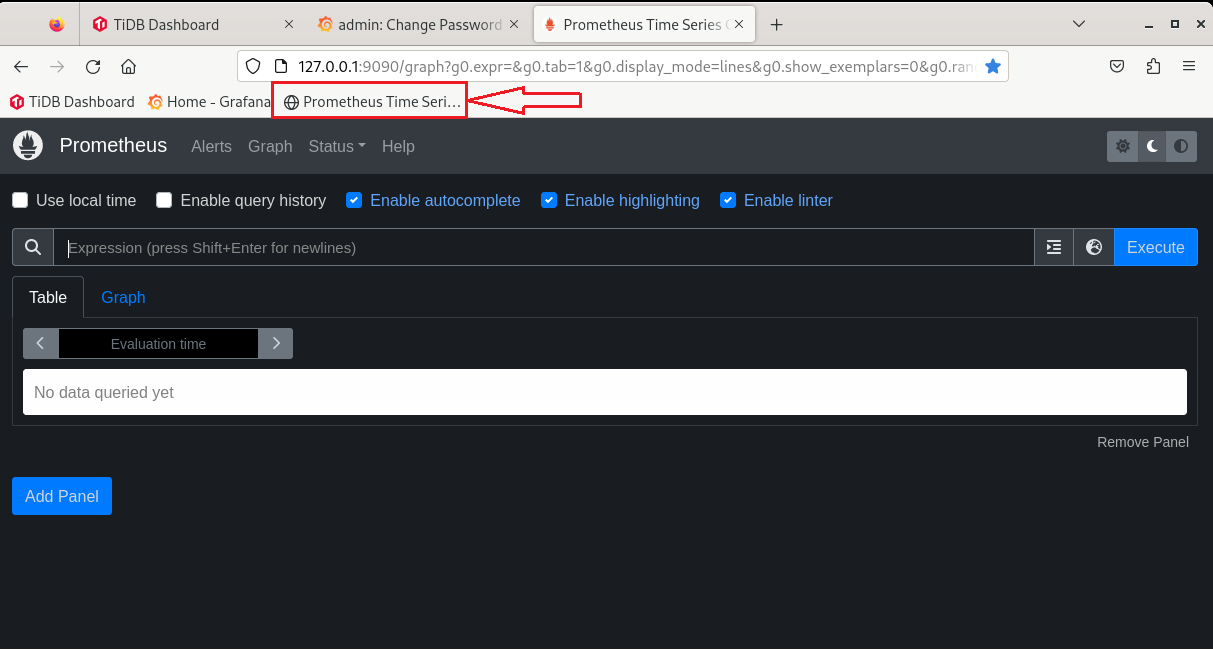
Prometheus-> http://127.0.0.1:9090
PD client endpoints-> 127.0.0.1:2379
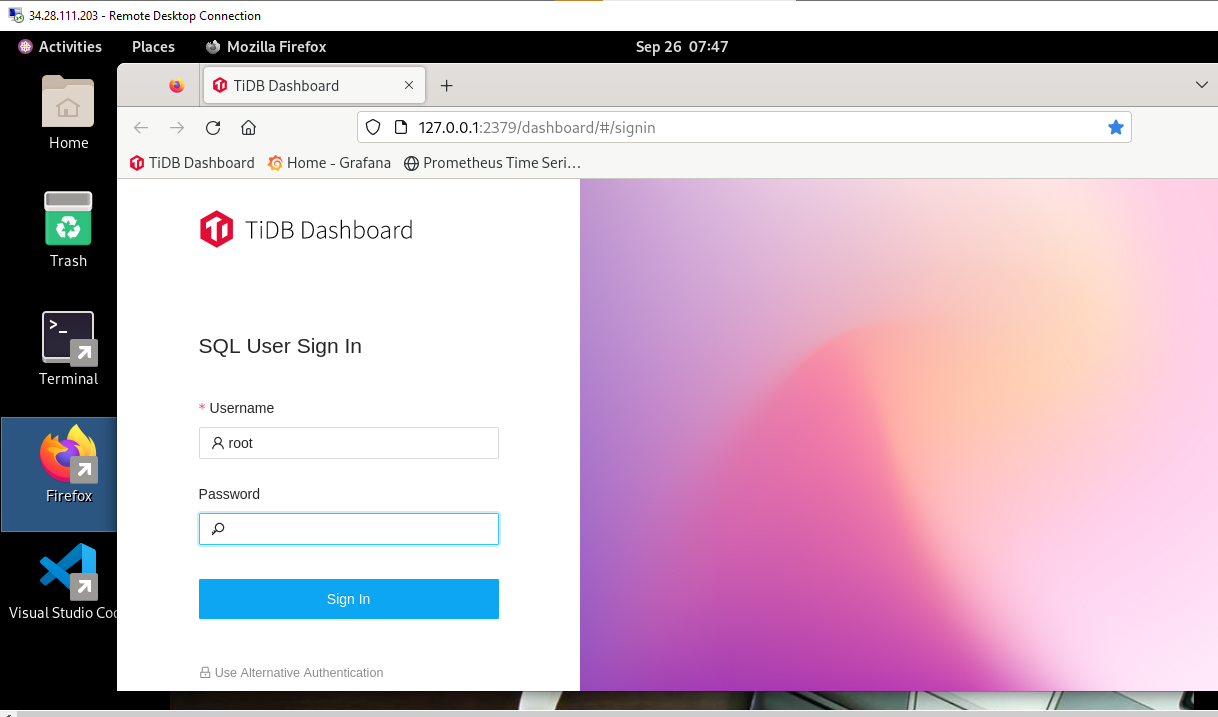
Username: admin
Password: admin
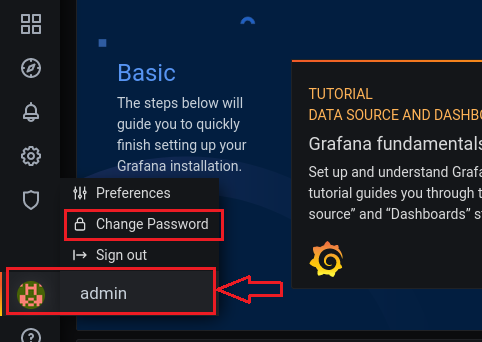
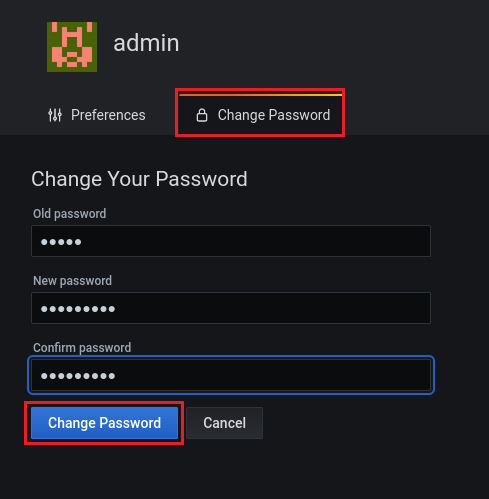
It will ask you to enter new password on next screen. Provide the new password here and continue to dashboard.
mysql --host 127.0.0.1 --port 4000 -u root -p
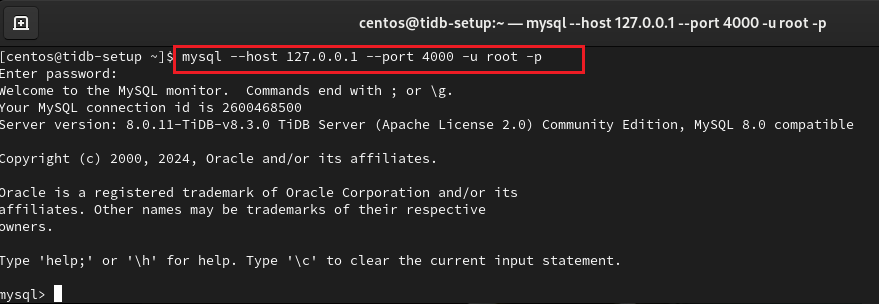
a. Run below command in terminal to access TiDB via mysql client. Hit enter if you did not set any password previously. Then run the ALTER command as shown below.
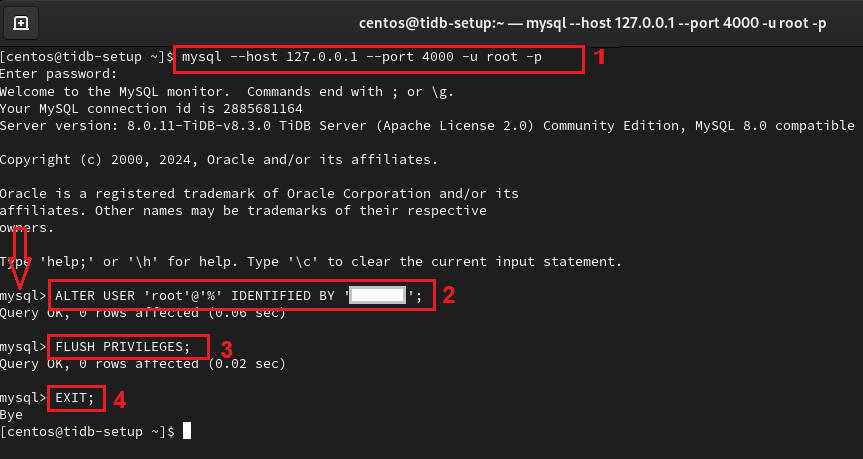
mysql --host 127.0.0.1 --port 4000 -u root -p
ALTER USER 'root'@'%' IDENTIFIED BY 'new_password';
Replace new_password with your password.
b. Flush the privileges.
FLUSH PRIVILEGES;

EXIT;
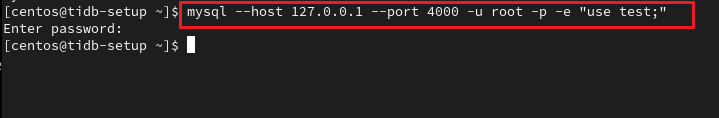
c. Now reconnect to DB using below command. It will prompt for the new password and set test as the DB to use.
mysql --host 127.0.0.1 --port 4000 -u root -p -e "use test;"
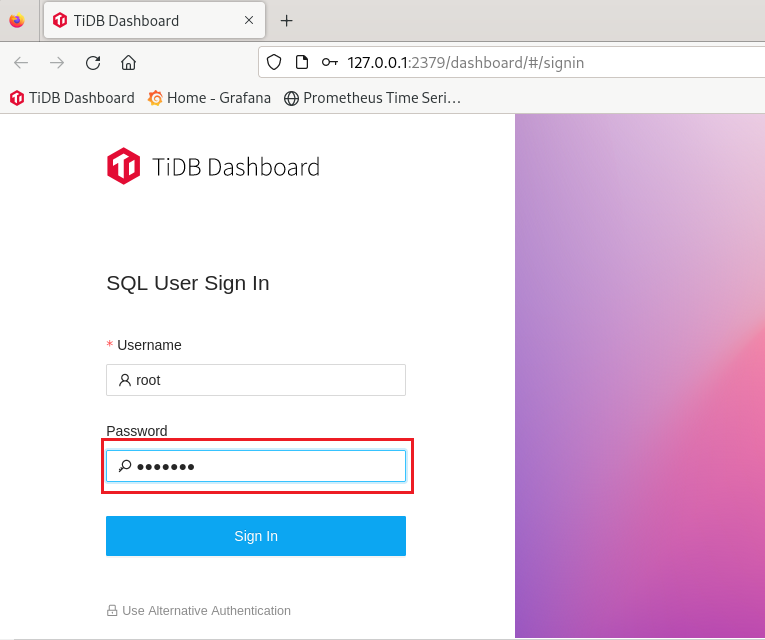
d. Now use the same password when logging in to TiDB Dashboard available at http://127.0.0.1:2379/dashboard using root userid.